What Is Missing in Your Risk Analysis?
1. Find
the lowest Risk trade from a group of potential stock picks.
2. Determine
the Risk versus the Gain Profit Potential BEFORE placing an order.
3. Determining
the correct Stop Loss placement to avoid setting the Stop at a whipsaw point,
or not using a Stop at all due to not knowing how to use and set them
correctly.
4. Selecting
the strongest picks based on Risk Analysis, which reveals weaknesses in stock
picks that do not show up in Candlestick Patterns or MACD patterns.
5. Choosing
stocks with Risk that you can tolerate. Too many times traders get greedy, and
choose picks that have higher Risk than they are ready to accept.
TechniTrader
"The Gold Standard in Stock Market Education"
Go to the TechniTrader
Trading
the automated markets along with Market Participant Groups that use Time
Weighted Average Price orders, Volume Weighted Average Price orders,
and High Frequency Trading predatory millisecond orders requires using
MODERN analysis and tools. It is hard to abandon techniques learned on the
internet that appear everywhere but in order to be successful, Traders need to
change how they approach trading.
When
choosing a stock to trade among a group of stock picks, consider the Risk of
the trade based on technical Support levels appropriate for your Trading Style.
Trading Styles include Intraday Swing, Swing Trading, Momentum Trading, Position
Trading, and several others.
Go to the TechniTrader Basics of the Stock Market for New Investors and Beginning Traders Webinar Lessons, to experience for yourself the excellence of TechniTrader education.
Go to
TechniTrader
Webinar Lessons
Strategies
are selected AFTER a Trading Style has been chosen. Certain Trading Styles
require specific technical patterns, candlesticks, and Support levels for
optimal trading success. Buying long versus Selling Short also changes Support
and Resistance levels for each Trading Style.
As
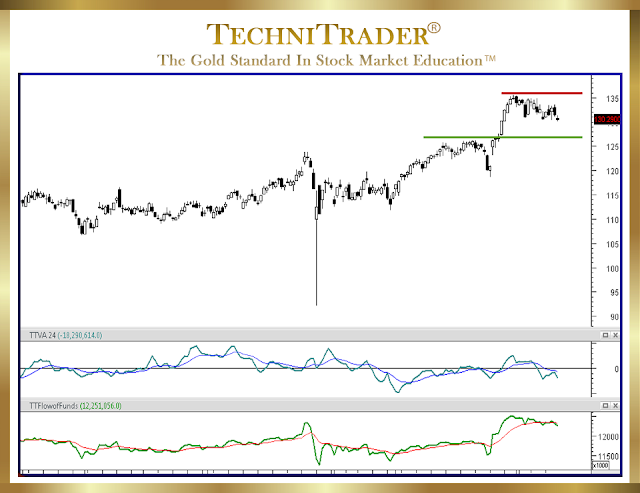
an example for Risk Analysis see stock chart below, which has an Engulfing
Black candlestick Sell Short signal.
The
next area of calculation must be the Support, which is where the stock is
likely to bounce up as indicated by the green line. This is the highs of
November, and may not hold over time but is the first level of Support for this
stock if it sells down further. Support therefore is based not on a Percentage
but the technical levels where bounces occur from Buy to Cover Professionals
closing their position, OR from “Buy on the Dip” Small Lot Investors rushing to
buy into what they believe is a bargain.
Go to the TechniTrader How to Trade the Stock Market Webinar for Beginners, to experience for yourself the excellence of TechniTrader education.
Go to
the TechniTrader
Summary
By
calculating the difference between the Resistance and the Entry Price, the Risk
of the trade is determined. By calculating the Support level where the stock is
mostly likely to pause or bounce, the run Gain Profit Potential is determined.
The final step is dividing the points at Risk by the points Gain Potential.
Risk to Profit should be 3/1 or higher.
Most
of the time Retail Traders are trading stocks with higher points at Risk than
there are potential points to Gain. Taking the time to calculate Risk using
Risk Analysis will significantly improve your profitability by eliminating high
risk and low profit trades.
TechniTrader
"The Gold Standard in Stock Market Education"
Go to the TechniTrader
Followers
may request a specific blog article topic by emailing info@technitrader.com
Trade
Wisely,
Martha
Stokes CMT
TechniTrader technical analysis using a MetaStock chart, courtesy of Innovative Market Analysis, LLC dba MetaStock
Chartered Market Technician
Instructor & Developer of TechniTrader Stock and Option Courses
TechniTrader DVDs with every course.
This weekly stock discussion is sponsored by TechniTrader.com a MetaStock® Partner
©2016–2024 Decisions Unlimited, Inc. dba TechniTrader. All rights reserved.
TechniTrader is also a registered trademark of Decisions Unlimited, Inc.


