Exposing Bottoming Strength Prior To Gaps
Stochastic is the most popular of all of the Price Oscillators available for stock chart analysis. In review of Indicators, they should be set up for your own personal trading style and trading parameters. Being as specialized and proprietary as you can possibly be with your own unique set of trading indicators is a huge plus, and gives you a decided edge against the professionals in the market.Using an indicator that is overly popular can be detrimental to your success as a Retail Trader. It can be hard to switch to a less known indicator because most traders want to be part of the crowd. But being part of the retail crowd means you are constantly at higher risk of whipsaw trades, as “Cluster Orders” are constantly being tracked by the High Frequency Trading Firms.
In comparing Wilder’s RSI versus the Stochastic Indicator, the advantage is that Wilder’s RSI is not widely used these days, and has the added feature of being highly adaptable and can be modified.
Go watch the TechniTrader RSI Oscillator Training Video to learn how to use it for extreme contrarian patterns, as a Momentum Price indicator before price moves, and to track Dark Pool Quiet Accumulation.
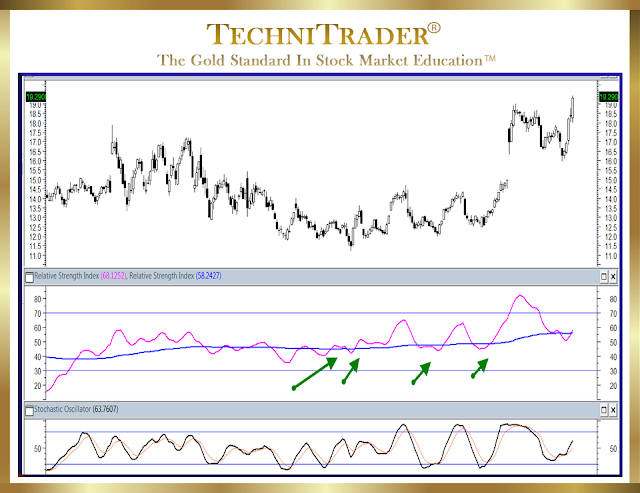
Below
in the middle chart window is an example of how I set up the Wilder’s RSI
indicator for my TechniTrader Students, and below is Stochastic in the bottom
chart window. This provides a visual comparison between these two
indicators, in relationship to price action in the chart.
As with volume oscillators, a center line oscillation feature for Wilder’s RSI adds depth to the analysis. Instead of looking at merely Overbought/Oversold patterns of highs and lows, when the RSI starts to waver around its center line it exposes the bottoming pattern of the stock before it gaps up.
Stochastic
as it is traditionally used strictly for Overbought/Oversold, is not exposing
the bottoming action underway. The oscillation actually causes whipsaw risks
during this bottoming phase.
Go to the Technical Analysis Webinar
with the 6 primary market conditions, percentage of time each occurs, how each
impacts trading and investing.
Go to the TechniTrader
Also RSI is a very different formula compared to Stochastic. Wilder wrote it to expose whether the current price was stronger or weaker than “X period” or number of days ago. Therefore what you are looking at is a Relative Strength relationship between the current price and “x number of periods” or number of days ago.
Therefore RSI can and does expose strengthening price action to the upside or downside in a sideways pattern. This is a huge benefit for Retail Traders because the markets move sideways about 60% of the time.
Summary
Although Stochastic is great for exposing the Overbought/Oversold aspects of a sideways pattern, what is even more important is to be able to anticipate what direction the stock will move and how fast it will move out of a sideways pattern.
RSI is superior in revealing strengthening price action, which in turn exposes momentum prior to gaps and fast runs. Use RSI as the market begins to bottom. It is a very underrated indicator that Retail Traders can use to see momentum building, prior to huge price gains.
Beginners go watch The Basics of the Stock Market for New Investors and Beginning Traders Webinar Lessons.
Go to the TechniTrader
Experienced Traders go to the Learning Center and
watch a wide variety of training webinars.
There are libraries of webinars for MetaStock.com Users, TC2000.com Users, and StockCharts.com Users.
There are libraries of webinars for MetaStock.com Users, TC2000.com Users, and StockCharts.com Users.
Go to the TechniTrader
TechniTrader
The Gold Standard in Stock Market Education
Trade Wisely,
Martha Stokes CMT
TechniTrader technical analysis using a MetaStock chart, courtesy of Innovative Market Analysis, LLC dba MetaStock
Chartered Market Technician
Instructor & Developer of TechniTrader Stock and Option Courses
TechniTrader DVDs with every course.
This weekly stock discussion is sponsored by TechniTrader.com a MetaStock® Partner
©2016–2024 Decisions Unlimited, Inc. dba TechniTrader. All rights reserved.
TechniTrader is also a registered trademark of Decisions Unlimited, Inc.
Disclaimer: All statements are the opinions of TechniTrader, its instructors and/or employees, and are not to be construed as anything more than an opinion. TechniTrader is not a broker or an investment advisor; it is strictly an educational service. There is risk in trading financial assets and derivatives. Due diligence is required for any investment. It should not be assumed that the methods or techniques presented cannot result in losses. Examples presented are for educational purposes only.


